Confusion Matrix
What does Confusion Matrix Mean?
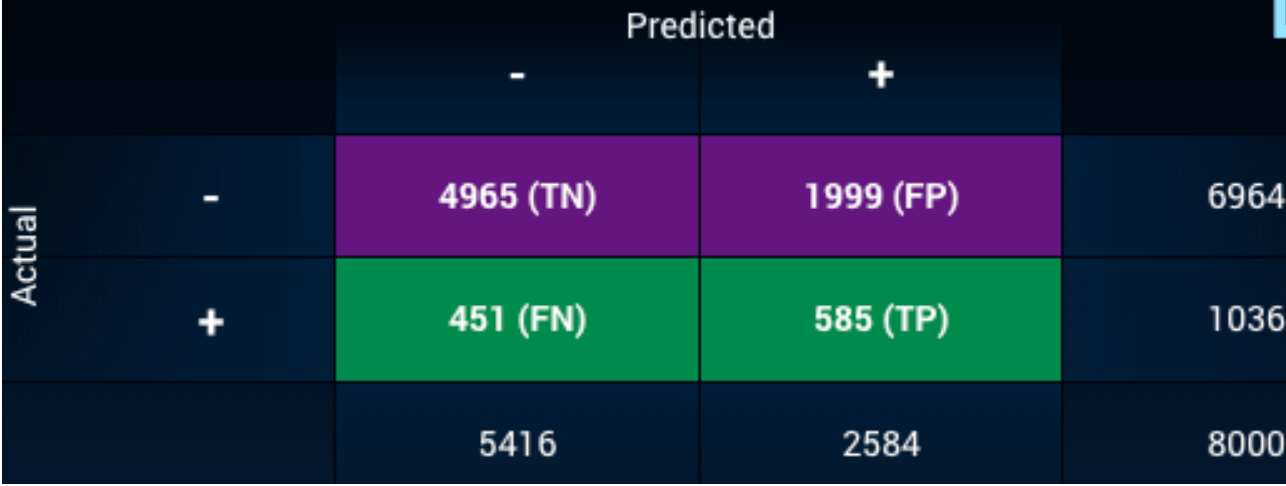
When you train a machine learning classification model on a dataset, the resulting confusion matrix shows how accurately the model categorized each record and where it might be making errors. The rows of the matrix represent the actual labels contained in the training dataset, and the columns represent the model’s outcomes.
Here is an example of a confusion matrix from the DataRobot platform:

Why are Confusion Matrices Important?
Confusion matrices make it easy to tell how accurate a model’s outcomes are likely to be by exposing when the model is repeatedly confusing two classes. They evaluate the performance of a classification model, allowing business users to determine which data their model may be unable to classify correctly.
This information proves invaluable when using insights or predictions from the model to make real-world business decisions. For example, when a model predicts that a credit investment opportunity will result in default when it actually doesn’t (false positive), there is a very different consequence than when the lender mistakenly funds a loan that does result in a default (false negative). If the user knows from the confusion matrix that their model is likely to result in false negatives for the loan dataset, they know to either use a different model or make improvements to the model through manual tuning.
Users can change the trade-off between false positives and false negatives by changing the threshold — the probability cutoff that splits a “yes” result from a “no” result. If a use wants fewer false positives and negatives, they can consider other models, feature engineering, or additional data.
DataRobot + Confusion Matrices
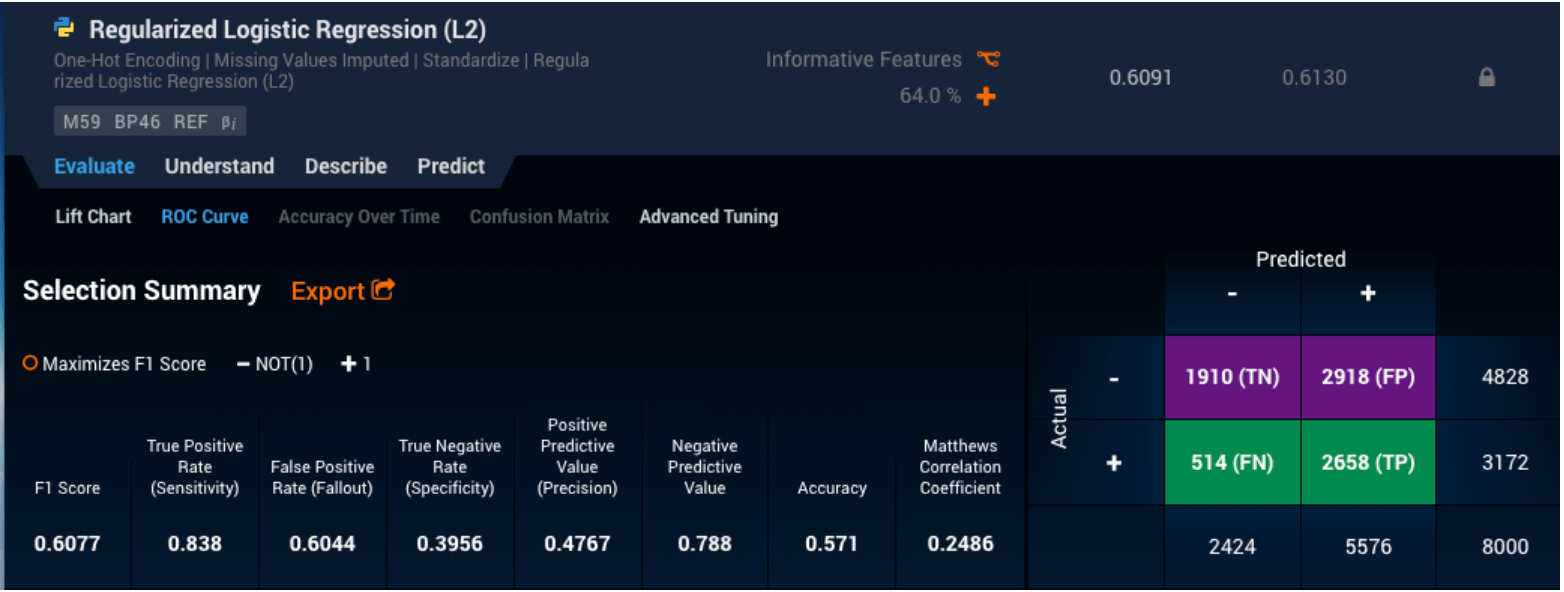
For binary classification problems (ones in which there are only two possible groups for each entry), DataRobot automatically generates a confusion matrix under the “Evaluate -> ROC Curve” menu option when you click on the individual model:

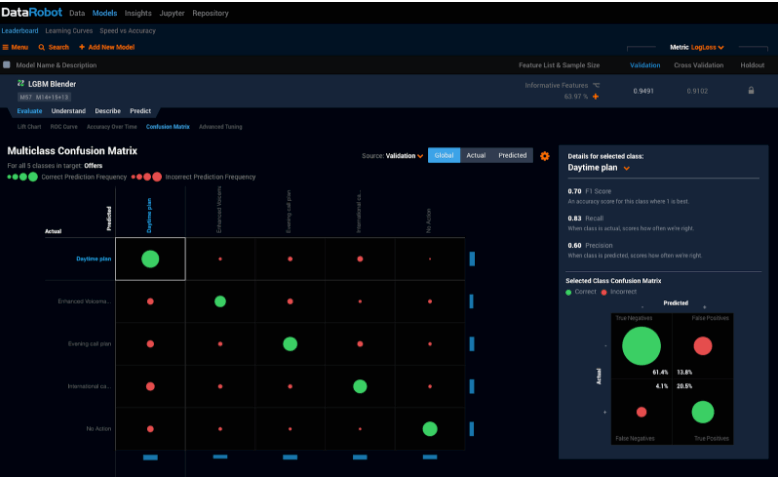
For multiclass classification problems (when the model could determine that each record falls into one of more than two different groups) DataRobot provides a tab dedicated to a more comprehensive confusion matrix:

A user can then compare the confusion matrices for each model that DataRobot produces, allowing you to choose the one that has the most acceptable levels of false positives and negatives for your particular business problem.


