Freshly cut grass, coffee, gasoline, cinnamon: all of these are very distinctive smells. To create the most alluring scents, the creators of fragrances have long relied on perfumers with a “good nose.” But those perfumers now have help from AI. AI is capable of predicting the scents based on the molecular composition of a product. This post shows you how to use DataRobot’s AutoML to predict what products smell like honey and coffee by using a multimodal dataset with multilabel classification.
Predicting physical and chemical properties of a potential molecule is part of R&D for chemerical engineering firms whether they are creating medicine or consumer goods. Traditionally, experimentation and observation was the only way to understand the physical-chemical properties of the molecule. To foster innovation in this area, AICrowd hosted a competition to predict the olfactory properties of a molecule. The objective of the competition is to predict the smell or aromatic properties of a given molecule. If machine learning could contribute, this would allow for the faster invention of new compounds tailored for particular aromatic signatures.
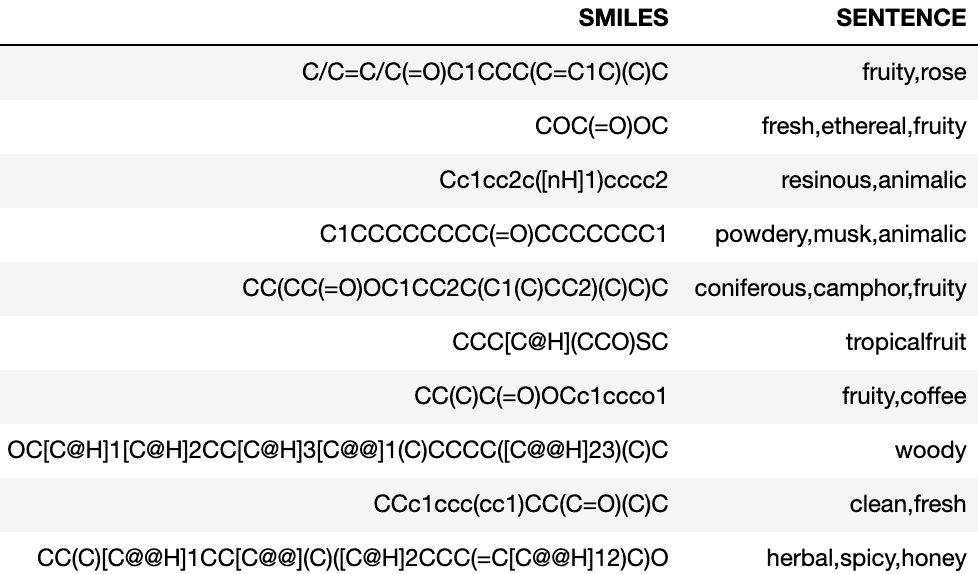
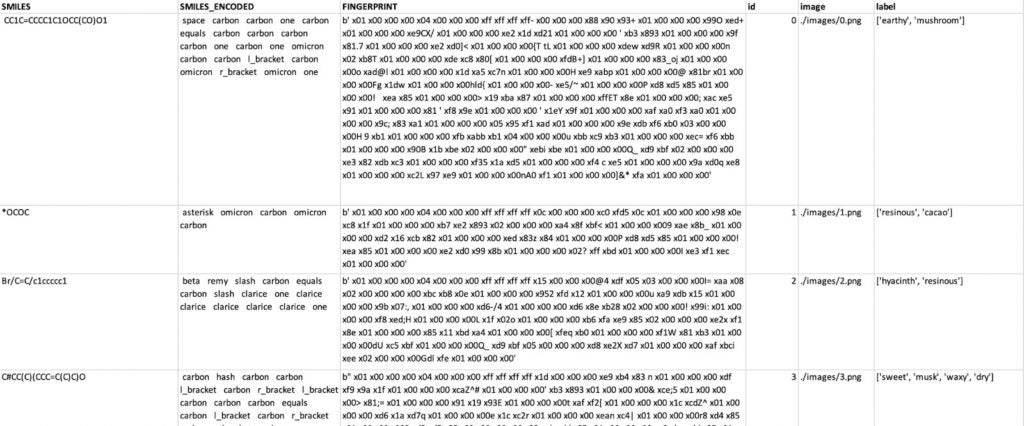
The dataset for this competition had two columns: SMILES and SENTENCE. Figure 1 shows some examples of molecules and their simplified molecular-input line entry (SMILE) representations. SENTENCE represents smells as the target or labels that need to be predicted. Each molecule has a combination of multiple smells. A SMILE is a chemical representation of a chemical molecule. It was introduced in 1980 but open-sourced in 2007, which created its widespread use. The SMILE notation advantages include readability, compression, and sharing. The database used for this competition is based on the Perfumery Materials & Performance dataset by Leffingwell & Associates and the Good Scents Company Information system. The dataset for the competition has been created by Guillaume Godin and Ruud Van Deursen (Firmenich SA) in collaboration with Igor Tetko (Helmholtz Zentrum München, BigChem GmbH).
The dataset has around 109 distinct values in the label; Top 100 labels will be picked for this experiment.
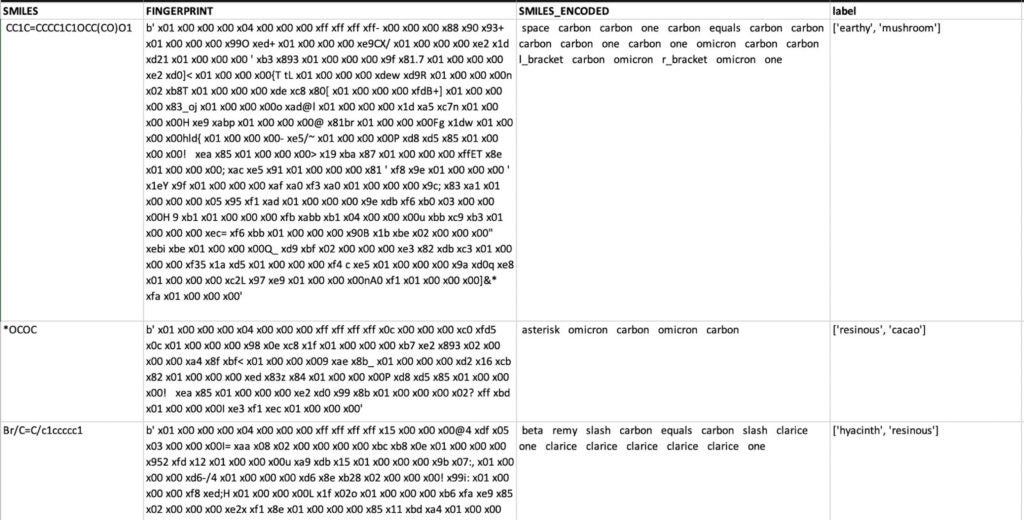
To make the SMILE information useful for machine learning, we started by using the Morgan fingerprint technique. This approach encodes each atom in the SMILE into multiple categories such as Element, Heavy Neighbors, and Halogen. This is accomplished using an open-source library such as RDKit. You can now analyze the new verbose extracted features using text-mining techniques such as bag-of-words.
With the dataset prepared, the next step is running a DataRobot multilabel project.
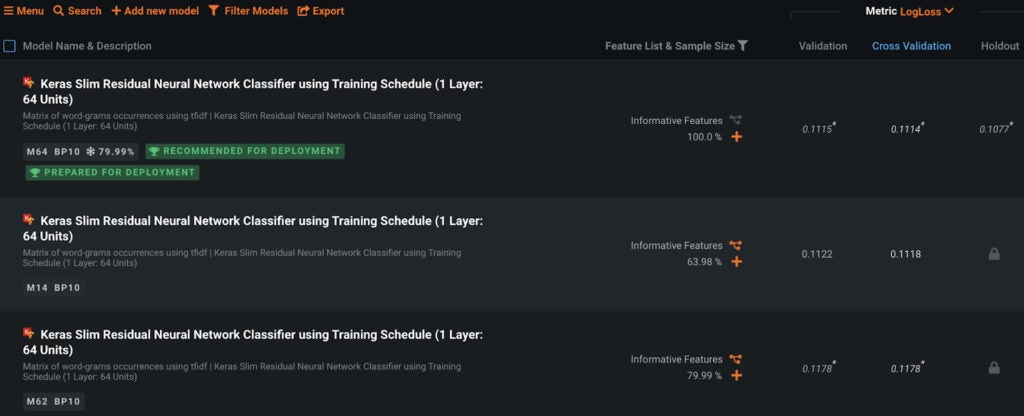
DataRobot’s AutoML uses different feature engineering techniques and a variety of machine learning algorithms to identify the best model for multilabel classification. The best model for this dataset is a Keras-based neural network.
DataRobot also provides per-label metrics so that metrics per class can be compared. Below are the per-label metrics provided by DataRobot for model evaluation purposes.
Figure 5
The competition metric is the maximum Tanimoto score of the top five recommendations to the ground truth averaged over the test dataset. The above model using fingerprint features scores a Top 5 TSS of 0.6838 on a holdout dataset.
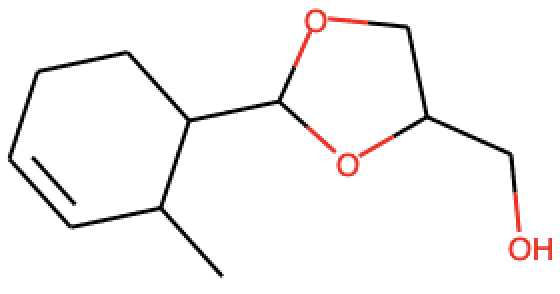
An emerging research stream is to use convolutional neural networks over images of molecules for predicting chemical properties. Molecules can be represented as graphs using the SMILE data. The diagram below shows how to visualize a molecule as a two-dimensional image.
It’s possible to add this image information as below to our existing dataset and build a new model with DataRobot.
Adding images to the dataset results improves the Top 5 TSS score to 0.6865! The best models use both the text information and a visual representation of the molecules.
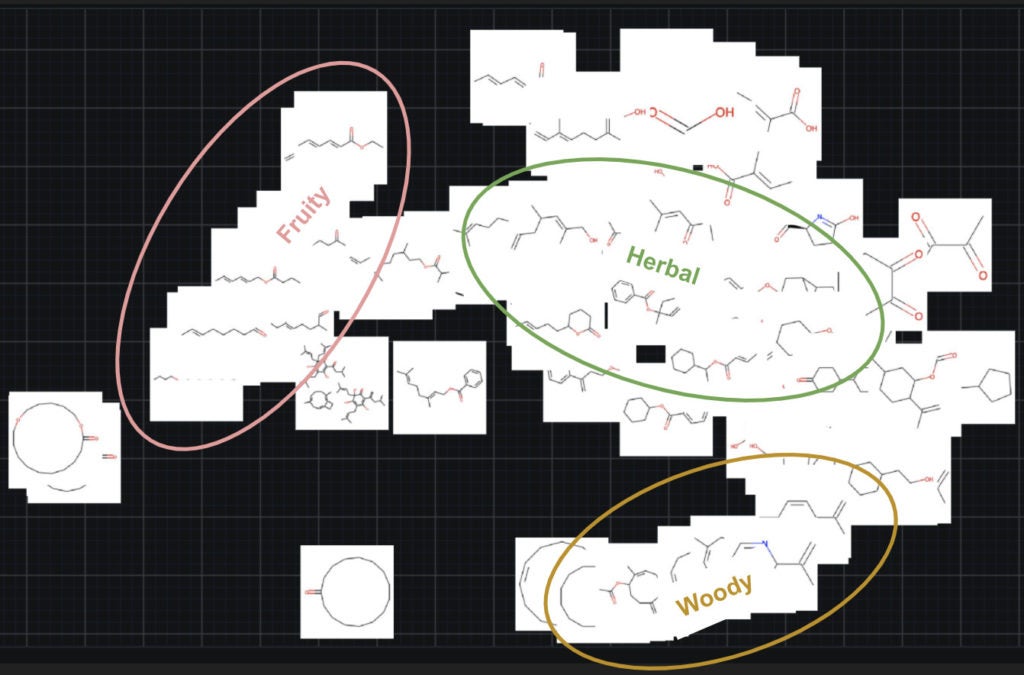
To understand how the images are being used, we can explore the explainability features for images of embeddings and activation maps. The first insight that DataRobot provides on image data is image embeddings, which visualize the discovered segments of the visual features. The figure below shows the embeddings of all the molecules. Upon further reflection of the embeddings, it’s possible to see clusters of particular molecules. We have highlighted this by indicating three clusters of fruit, herbal, and woody molecules. This clustering suggests that the images are carrying information about the type of molecules they are.
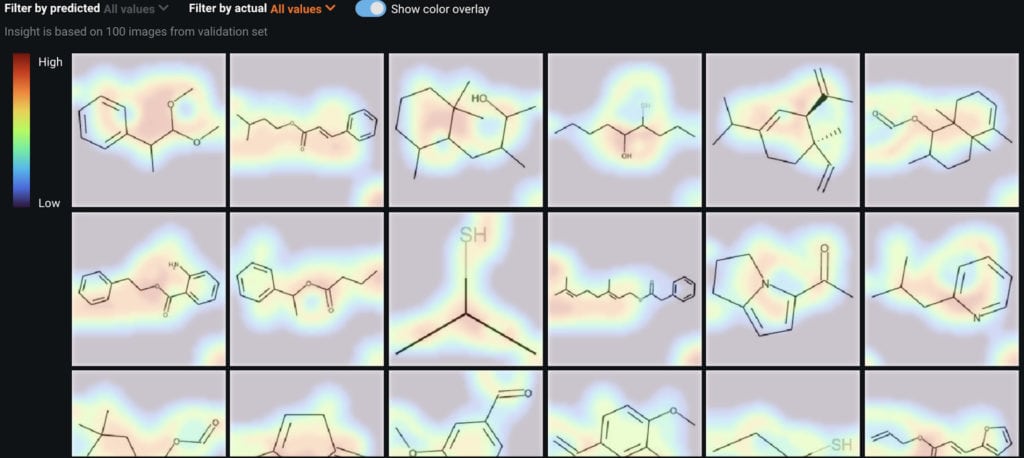
A second insight DataRobot offers is activation maps, which indicate what part of an image the model is using. From the activation maps, it’s clear that the models are looking across the entire molecular structure.
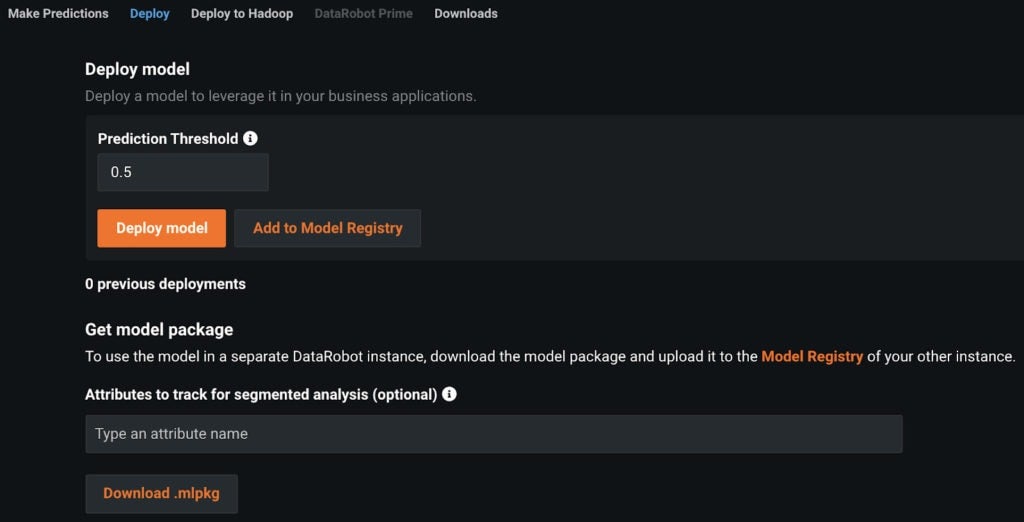
The final step to using this model is deploying it into production. With DataRobot this is a one-click step.
You can use DataRobot to predict the physical-chemical properties of chemical compounds such as olfactory properties. This was a challenging use case that required supporting both text and image type data using a multilabel outcome. Once this model has been created, the next step is using it in a simulation environment where keying in chemical formulas will result in a prediction of the aromatic signature of the compound. This approach can try out many different formulas using the model that we have created. It helps to reduce the cost, time, and effort used in traditional processes of synthesizing a compound and finding the result.
About the author
Abdul Khader Jilani
Lead Execution Data Scientist
Abdul Khader Jilani is a Lead Execution Data Scientist at DataRobot. Abdul develops end-to-end enterprise AI solutions with DataRobot Enterprise AI Platform for customers across industry verticals. Before DataRobot, he was a Principal Data Scientist in Microsoft and Computer Associates, Inc.


